Primary vs secondary, the emerging copper market landscape?
Opinion Pieces
7
Jan
2025
Primary vs secondary, the emerging copper market landscape?
All cost values stated in this article are All-In Sustaining Costs (AISCs) on a CIF basis expressed in US$/lb of contained Copper within a concentrate on a pro-rata basis unless otherwise stated.
Our recently published Copper Concentrate Cost Tracker provides a comprehensive analysis of global copper-producing mine assets, with granular cost data from 2015 to 2023. The service offers unique insights into mining and processing cost breakdowns at an asset level.
This copper cost analysis follows a period of increasing demand. Post-Covid, copper consumption surged 3.5% from 2020 to 2021 and 7.0% between 2020 and 2023. The market is varied in usage, primarily driven by manufacturing and construction projects, along with a new focus on green energy and technological advancements. China dominates demand, accounting for 56.7% of refined copper consumption in 2023, while Europe and North America are responsible for 10.0% and 8.2% of consumption, respectively.
Costs. Eat. Margins.
In 2023, Project Blue estimated global demand for refined copper at 25.5Mt, with refined supply at 26.0Mt (an increase of 13.0% since 2017). Refined copper cathodes can be produced through two methods, depending on the ore type: sulphide or oxide. Sulphide ores, commonly found in Chile, Peru, and the USA, typically have higher grades (0.5–2.0% Cu) and dominate 79.0% of the extractive market. These ores are first processed into copper concentrate, which is then smelted and refined into cathodes. Conversely, oxide ores, prevalent in Zambia and the DRC, have lower grades (0.2–1.0% Cu) and are processed directly into copper cathodes using solvent extraction and electrowinning (SX-EW). These ores have historically been less attractive; however, advancements in heap leaching and SX-EW processes have made it economically viable to exploit lower-grade ores. This shift has been further driven by the depletion of high-grade sulphide deposits and growing concerns about the environmental impacts of sulphide ore extraction.
Alternatively, copper can be produced from secondary materials. In 2023, 4.6Mt of refined copper cathodes were produced from recycled materials such as scrap. A further 7.0Mt of scrap was directly melted by fabricators to produce copper and copper alloy semi-manufactures. While recycled copper materials compete directly with extractive products, scrap melted by fabricators is mainly used to supplement cathode supply. Semi-manufacturers use refined copper and scrap to produce intermediate products such as wire, rods, bars, sections, plate, sheet, strip, tube, foil, and castings. These intermediates are further processed into final goods across various end-use applications.
Project Blue’s copper cost analysis begins with a review of the extractive concentrate sector. Since 2017, rising demand and turbulent global economic factors have driven substantial increases in both copper production costs and prices. Globally, the cost of producing copper concentrate increased by 55.1% over this period, while copper prices increased by only 37.5%.
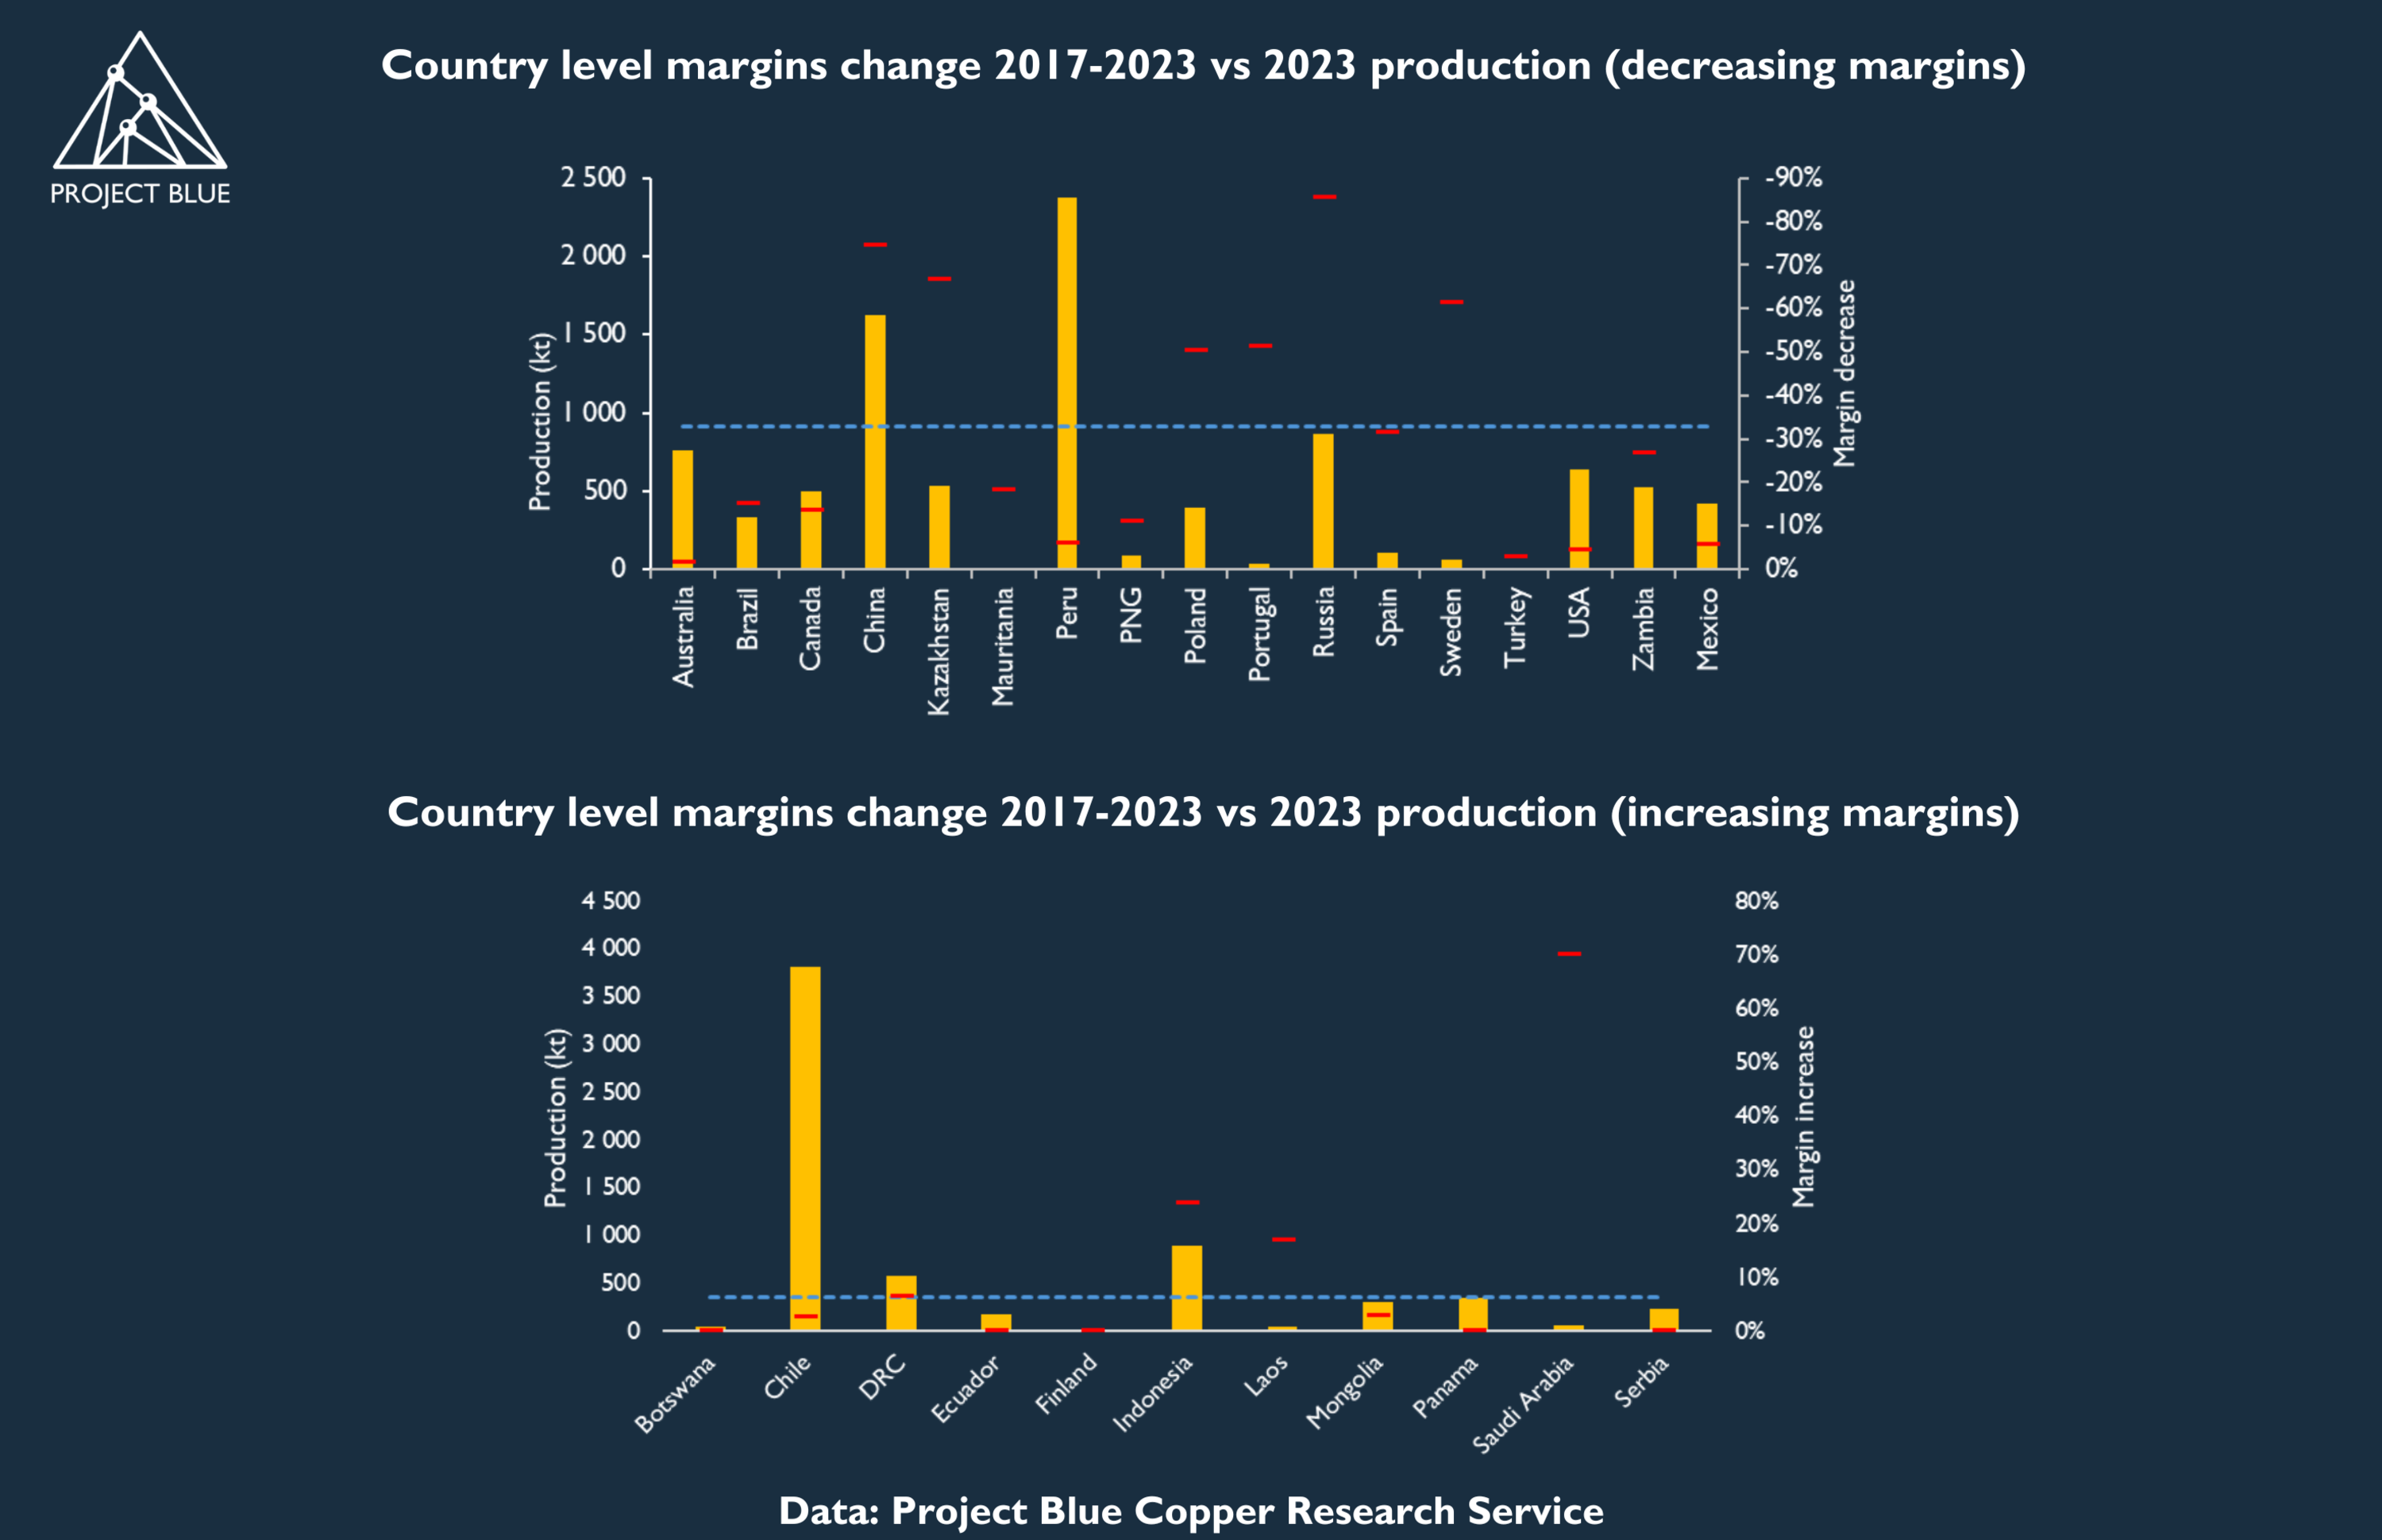
China and Russia, responsible for 10.0% and 5.0% of world output, respectively, have seen the greatest cost increases. Since 2017, Chinese production costs have risen by 123.0%, while Russian production costs have risen by 112.0%. Despite these increases, both countries continued to increase production, contributing equally to 7.0% of the total market growth over the same period. Although China benefits from lower input costs, declining grades and a desire to increase copper supply have exerted upward pressure on its cost curve. Meanwhile, Russia’s rising costs reflect the broader impact of the country’s post-war economic environment on its commodities sector. Other large-scale sulphide producers, such as Chile and Peru, continue to operate closer to the price rise. For example, Chile outperforms the general decreasing margins with a marginal cost increase of 34.9% since 2017. The DRC, a noteworthy oxide producer, showcases a comparable cost profile to Chile and Peru, recording a 31.1% cost increase at a total of US$2.10/lb in 2023 (compared to US$2.22/lb in Chile).

Despite global cost increases outpacing price growth, 94.9% of the market remains profitable, a slight decline from 97.6% in 2017. However, at the country level, only 44.0% of market supply is produced at costs below the rate of price increases, indicating that more than half of producers have experienced shrinking profit margins over time.
Additionally, since 2017, producing countries with shrinking profit margins have experienced an average cost increase of 32.9%, compared to a cost decrease of 6.3% in countries with growing margins. This suggests that if margins continue to decrease, costs will likely impact producers more rapidly, especially given the market’s increasing sensitivity to current cost trends.
If costs continue to increase relative to prices, the market could look to alternative supply methods. Extractive supply increased by 4.5% between 2022 and 2023, compared to 7.9% in the secondary refined copper market, raising the question of whether this is causation or correlation.
Secondary market: the present or future?
Scrap is used for many reasons, but mainly because it is readily available, high quality, and cheaper to use than refined copper cathodes. Proponents of recycling technology say it also saves 85.0% of energy compared to refined copper from mined ore and reduces 90.0% of the carbon dioxide greenhouse gas footprint. For low-value semi-manufactured products where copper’s electrical properties are not critical, using 99.99% purity copper cathodes would be unnecessarily expensive.
In traditional extractive mining, increasing the copper supply involves multiple preliminary stages, including exploration, discovery, capital investment, construction, and, most importantly, time. On average, Project Blue estimates that it takes over 15 years for a new mine to become operational. By contrast, recent data shows that China can construct a secondary refinery and produce refined secondary products within 12 to 18 months, compared to 24 to 30 months in other countries.
To simplify the combined totals of scrap and secondary products, we will refer to them as Consolidated Secondary Products (CSP). Considering the advantages outlined above, CSP emerges as a practical, environmental, and economical alternative to primary production. However, the supply of scrap—critical to CSP production—is finite, limiting its scalability in the short term.
CSP currently accounts for 36% of total copper consumption, making it an integral part of the market. The volume of direct-use secondary materials varies by product line and country, often depending on the local supply of suitable materials. Availability and price discounts (relative to refined copper) can fluctuate significantly from year to year. Globally, CSP supply is primarily influenced by the copper price, with intense competition among smelters, refineries, and fabricators for access to this desirable feedstock.
What impacts will affect the desirability of secondary products? Beyond the cost curve.
With the rising costs of extractive methods, could eroding margins shift a greater share of the market to secondary producers, given their lower capital requirements and more rapid response to growing demand? If so, where will this additional supply originate? Currently, high levels of demand and prices are keeping 94.9% of extractive producers operating at a profit, although this percentage is decreasing. China dominates global demand for both refined products and scrap at 57.1% and 46.2%, respectively, growing 8.7% and 7.5% since 2017. Conversely, the country only contributes around 7.5% to global supply. Domestic producers rely heavily on imported intermediate copper products, such as concentrate, blister, anode, and scrap, to supplement domestic mine production and meet the growing copper demand attributed to the country’s construction and manufacturing industries.
China is also the largest producer of secondary copper, contributing 60.0% of the global total in 2023. Japan follows with a total of 9.0%, Germany at 6.0%, and Russia and Belgium with 4.0% each. As global extractive costs have risen, copper prices for refined products have reflected this. China’s efficiency in refinery construction and CSP production, combined with narrowing margins in refined copper and the possibility of rising cathode prices, highlights its growing dominance in the CSP market and the significant potential for increased demand.
Notwithstanding China’s increased demand, as the country looks to supplement its construction and manufacturing industries and offset potential cost-impacted price rises for refined products, other consumers around the world may look to increase CSP demand. Additional impacts affect demand, such as environmental regulations and technological advancements, though challenges such as impurity levels, collection and sorting inefficiencies, and market volatility persist. Initiatives such as circular economy models, innovative recycling technologies, and industry collaborations have enhanced recycling rates and efficiency. As global copper demand increases, particularly in renewable energy applications, secondary production will become even more vital, necessitating continued investment in recycling technologies and supportive policies, laws, and regulations to enforce or incentivise recycling. Finally, end users are becoming increasingly enthusiastic about purchasing recycled material, inclusive of a ‘green premium’ often passed on to the consumer, where demand leans towards sustainably sourced materials.
Global capacity potential…
With global copper demand estimated to grow more than 20% by 2030, assuming the aforementioned shifts in the copper market, additional supply would be required to support increased CSP demand. By nature, CSP feedstock (recyclable scrap) is technically readily available and effectively endlessly recyclable. Unlike extractive resources, its supply is not geographically constrained. Currently, several projects in various stages of development are targeting diverse feedstock options, including standard (high-purity scrap), mixed (varied-purity scrap), and complex (e-scrap). The diversity in operations results in a wide range of costs. Two standard operations currently under development include, but are not limited to, AMES Copper Group in the USA, which invested US$50M to set up a 48ktpy capacity anode plant, and Cunext in Spain, which invested roughly €200M (US$206M) to establish a refined cathode capacity of 205kt. These operations indicate that approximately US$1M in investments should return a capacity of 1kt. Investments in e-scrap treatment are much more costly. For example, Atlantic Copper’s investment at its Huelva smelter in Spain for its e-scrap module cost US$350M to treat 60ktpy of e-scrap to produce 30ktpy of cathodes. However, e-scrap developments benefit from significantly higher-value by-product credits (gold, silver, nickel, tin, PGMs, and rare earth elements).
Government legislation and incentives will be significant in accelerating copper recycling. As discussed, China continues to focus on high-grade copper scrap imports. Furthermore, the Indian government will require minimum recycled content levels for copper of 5% from 2028, 10% in 2029, and 20% by 2031, driving rapid advancement in domestic refining and recycling capacity. Western governments also favour incentives, with the EU having introduced a new Waste Shipments Regulation that sets out stricter rules on the export of waste to non-EU countries, and the USA has earmarked substantial capital towards local recycling facilities.
Conclusion.
As extractive costs rise and margins for copper cathodes narrow, a shift in supply and demand dynamics for alternative copper products seems increasingly plausible. But how will this shift be realised?
-There are strong arguments to suggest CSP could increase its global supply share as governments incentivise new supply and consumer desire for ‘green’ products grows. However, the development of infrastructure is needed to meet global demand requirements. Although minimal timing of construction and locally available supply, which offers efficient feedstock routes, simplifies the process of augmenting supply compared to its extractive counterparts.
-Will oxide mining get cheaper? The DRC and Zambia offer lower-cost inputs, although they are associated with other geopolitical issues. However, technological advancements within heap leaching and SX–EW processes provide an encouraging outlook compared with sulphide mining. At present, the DRC, on average, offers a lower cost profile than its cost-competitive sulphide counterpart, Chile.
-Currently, Chile and Peru dominate the supply of refined copper; however, decreasing margins, declining grades, and negative environmental impacts associated with sulphide ore extraction may disrupt the status quo. Nevertheless, given the development of current capital, there is potential for producers to move towards a diversified product supply chain.
As highlighted in this review, our cost service offers a current and historical analysis across the market, giving the user a detailed breakdown of individual assets with the ability to compare and adapt the data to their needs.
Our analysis aims to showcase these features while providing insight into the current landscape of the copper market, how our data can be used to draw coherent and structured hypotheses about supply-side dynamics, and how costs may shape the market share of production looking forward.